Data: Too much?
A little over a year, I scraped the review data from TripAdvisor.Com (TA) for the hotels located in Las Vegas, NV, USA, where I used to go to university. Back then, I majored in Hospitality Management where my primary background has been built up. Put aside the bitter-sweet memories (lyrics from Whitney Houston), let me continue the brief about what I planned to do.
I originally aimed at analyzing all the hotels available to scrape (Total=460,000 Reviews scraped) in Las Vegas from TA in order to (hopefully) find the NEW dimensions specific to casino hotel. It first sounds awesome to me, but I realized it was just too much to even clean up the mess (preprocess) all of them in few hours with my PERSONAL COMPUTER! This was the moment when I got a little sense of so called Big Data though people in the field might still laugh at the size.
Someday before starting the R, I saw very promising catchy phrase of R can do Big Data Analysis! But I missed the equally important part, WITH PARALLEL COMPUTING!. Back then, I didn’t even understand the terminology of parallel computing. What a shame that I didn’t even know how many cores my PC has.
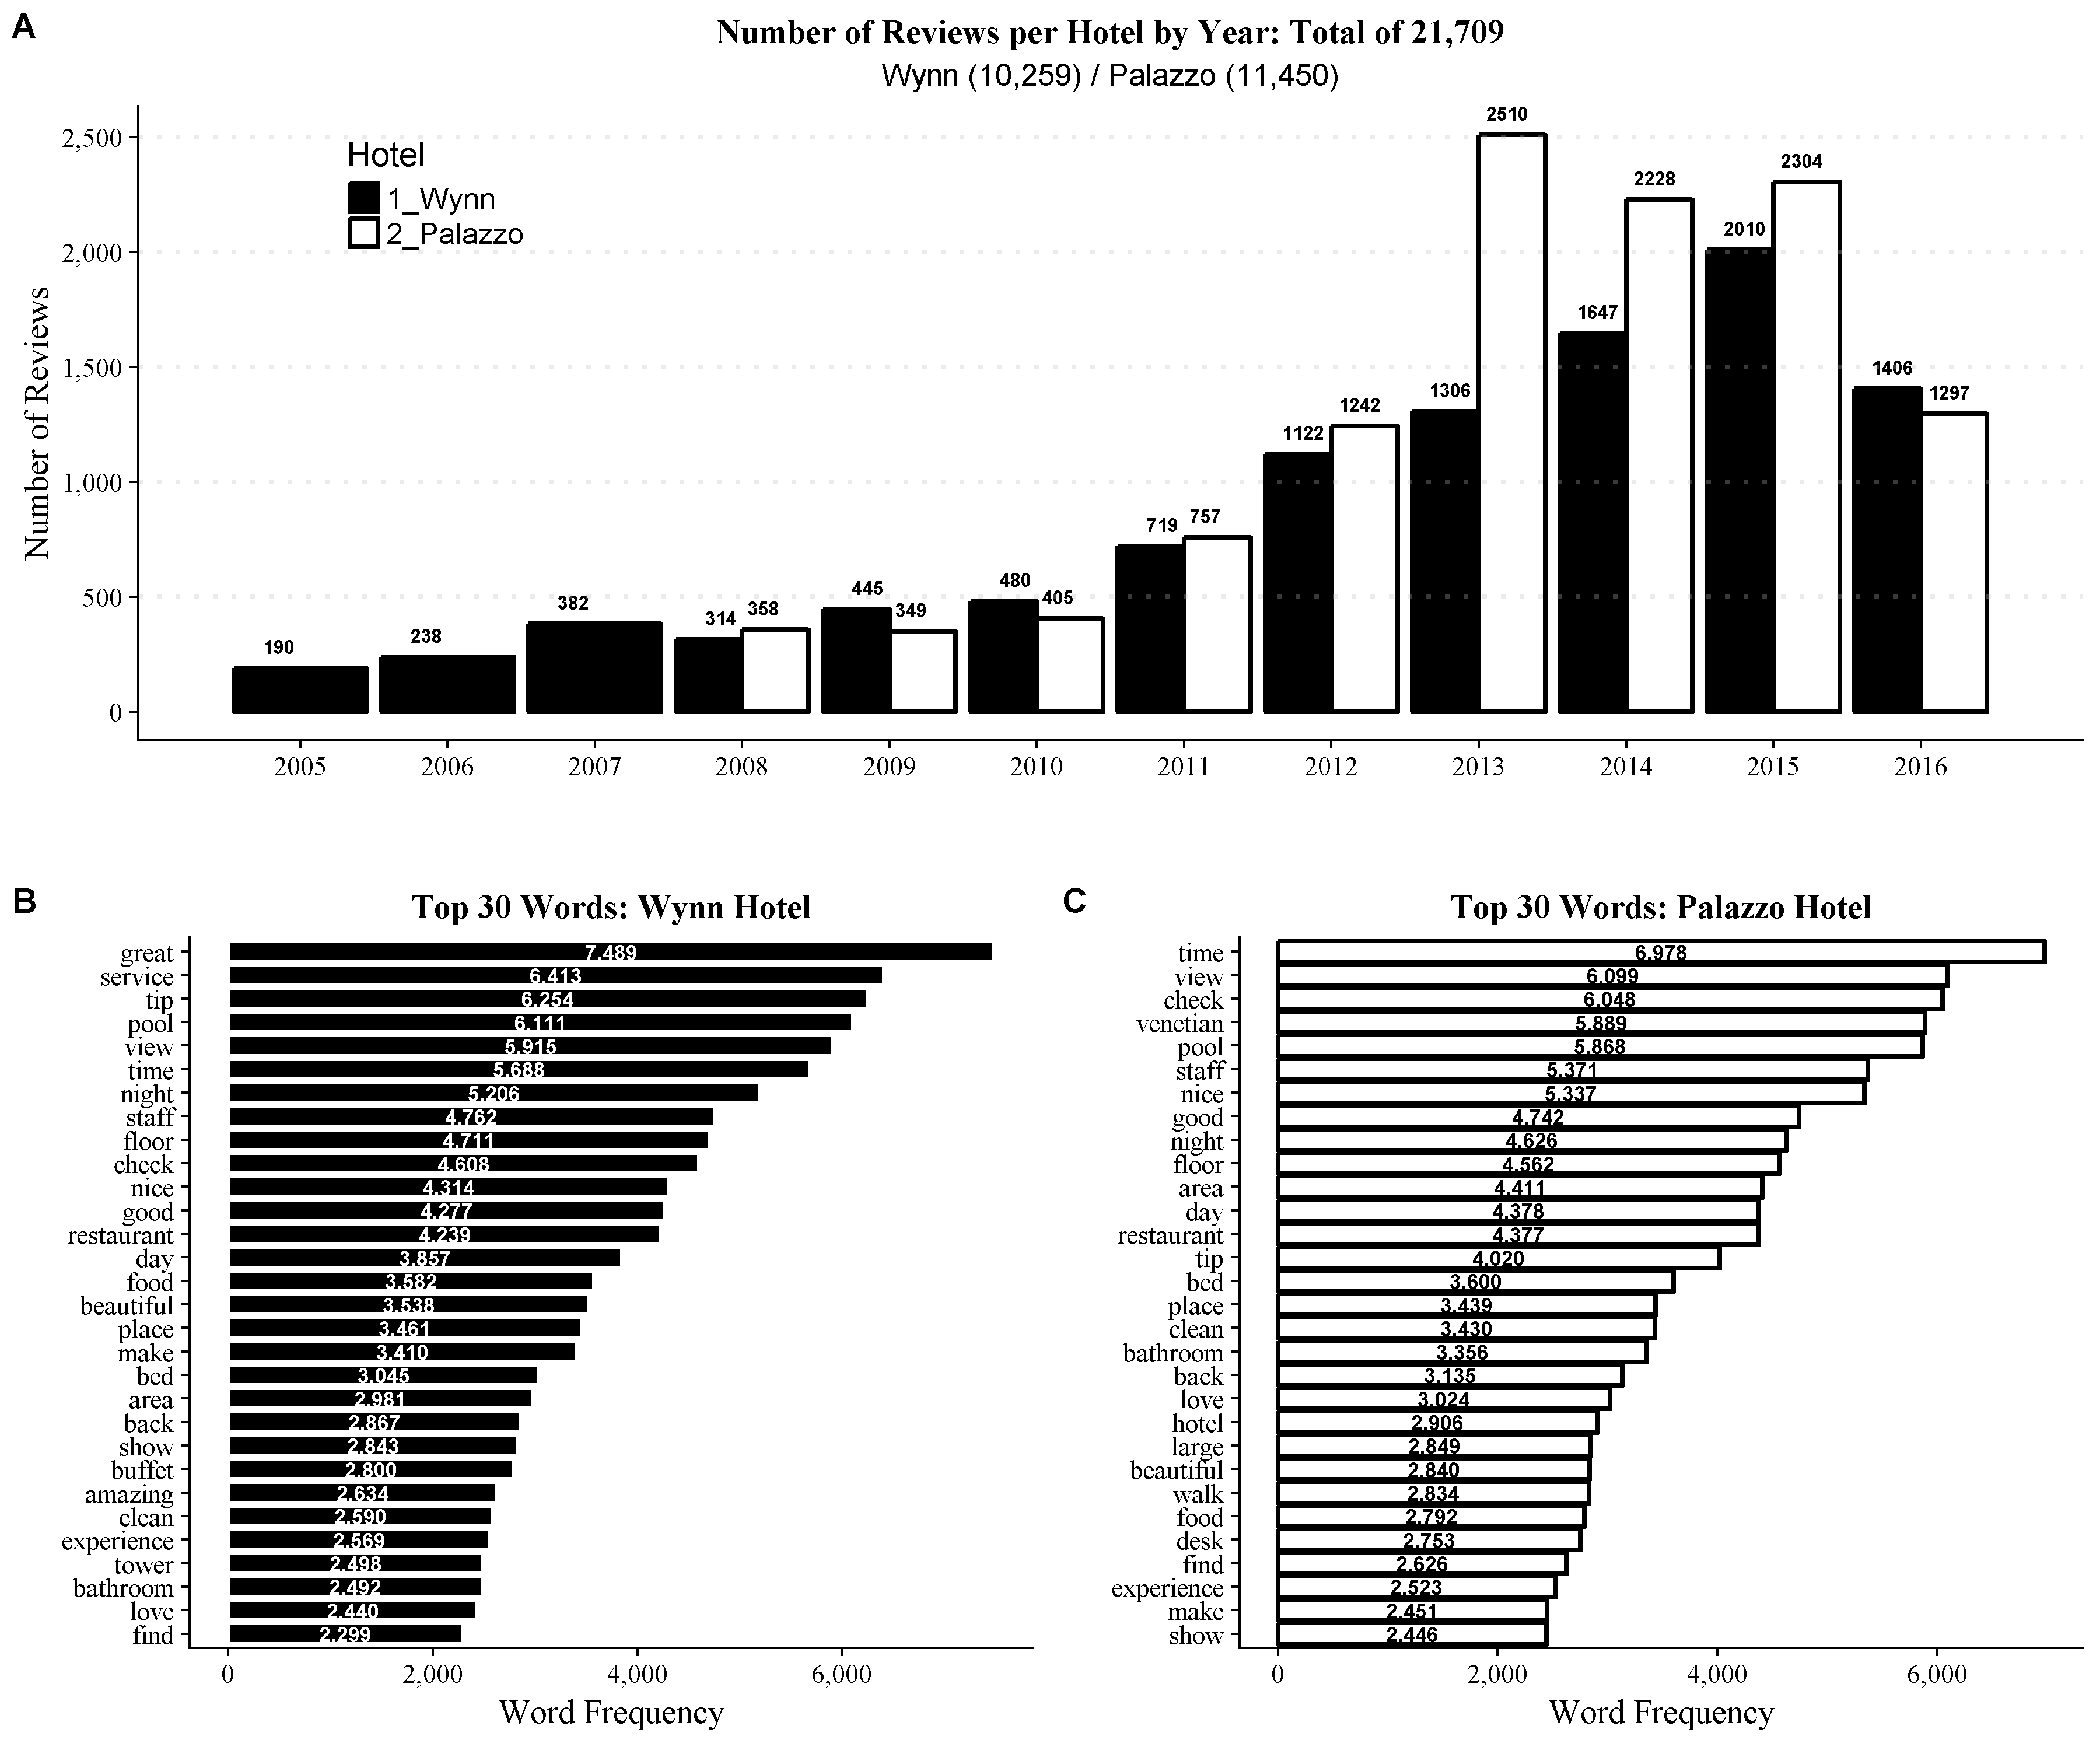
Anyways, since I am still struggling to deploy the analysis with parallel computing (though sparklyr still gives me a hope…Yes I am not giving up on learning too!), I got no additional time to spend playing around with such stuff since the due date was coming. We all have some sort of due, right? So, I decided to experiment of my proposed framework (..sounds like I am doing something cool) with two hotels, namely Wynn and Palazzo. They are nearly equally volumious in terms of number of reviews, and eqaully rated by Forbes Travel Guide. Plus, they are located right next to each other.
Following image is the summary of reviews by each hotel from my working paper.
Locations of Wynn and Palazzo
Using recently learned leaflet library (I like this kind of part: Dynamics!), location for hotels are displayed as follows:
If you zoom in, you will find two hotels are inside the rectangle. Those two are located very close at the same spot. For those of you who are familar with Vegas, you know the geographical merit they have (i.e. Fashion show mall, Treasure Island, Convention Center, and list keeps adding)
Overview: Workflow
I briefly outline what I planned to do. Originally,
I started analyzing with
WynnHotel only from pre-process to final analysis of Structural Topic Model (STM) that I will cover some time later.Then, I did the same for
Palazzohotel.Next, I had to combine the data for
WynnandPalazzoby adding the binary variable ofhotelwhich identifies the hotel with sentiment result. To me, this approach was better since sentiment classification byStanford CoreNLPalso took significant amount of time. Each hotel took nearly 4 hours for a little over 10,000 reviews with my PC,i7/Cores=4. It was done as if I split the chunk of data which I actually didn’t plan to. Smile~)Finally, those combined data were the inputs for STM. This way, I could come up with common topics for those two and directly compare the same topics by
hotel.
Fitting STM for each hotel separately does not gaurantee that they will have
Identical number of topics: Optimal K (dimensions) might differ by hotel
Identical topics to compare: You know labelling or interpreting topics after fitting topic model are not a trivial task.
Note: From now on, I use the term dimensions instead of topics.
In that regard, combined data with sentiment result for both hotels are created after some manipulations. I firmly treat this part as the most siginificant and time consuming part, and this is where I started to love about the tidy way in R. Currently, David Robinson offers the overarching tidyverse course at Datacamp! For those of you who plan on learning R, I personally and strongly recommend to start learning tidyverse FIRST!
New blog post: Announcing "Introduction to the Tidyverse", my new @DataCamp course https://t.co/4XKLOChICq #rstats pic.twitter.com/HB6NdXJwzj
— David Robinson (@drob) November 9, 2017
Anyways, sample data for the analysis are shown below:
Note: Ok, I really need to learn how to configure the insertions.
For my next post, I guess I have to start summarize data munging part which I think the endless part until you really get it published!
Cheers!